
If you work in sales, finance or business development, you’ve probably been there: your client is interested, they’re nearly convinced – but they need clear financial proof that the investment makes sense.
That’s exactly where an ROI calculator in Excel becomes essential. It turns assumptions into numbers, supports business cases, and helps decision-makers evaluate value, payback and financial impact.
In this guide, you’ll learn how to create a clear ROI calculator in Excel – and how that Excel model can later be turned into a secure, shareable web app when you need to use it with customers, managers or larger teams.

Why ROI Calculators Are Essential for Sales and Business Decisions
When clients decide to buy, they’re essentially weighing value against cost. An ROI calculator in Excel:
- Clearly demonstrates potential savings or earnings.
- Helps clients quickly visualize value, reducing decision-making anxiety.
- Gives your sales conversations a credible, professional feel.
Bottom line: It moves conversations from subjective opinions to concrete numbers your clients can trust.
Step-by-Step Guide to Building Your ROI Calculator in Excel
Step 1: Set Up Your Excel ROI Calculator Sheet
Start simple. Open a fresh Excel workbook and create three clearly labeled sections:
- Inputs: Initial investment, costs, timeframes, expected benefits.
- Calculations: Formulas that compute ROI based on inputs.
- Outputs: ROI %, Net Profit, Payback Period.
Color-code for clarity – green for inputs, red for outputs, and blue for tables or charts.
Step 2: Define Inputs Clearly
In the input section (colored green), list fields clearly. Common inputs for an ROI calculator Excel include:
- Cost of your product or service
- Additional ongoing expenses
- Estimated additional revenue or savings per year
- Length of investment period
Keep input fields flexible, so your client can easily adjust and test different scenarios.
Step 3: Add ROI Calculations
In your calculations section, clearly outline how you derive ROI. The basic ROI calculation formula is:
ROI % = (Net Profit / Initial Investment) × 100
Break it down into easy steps:
- Net Profit = (Annual Revenue or Savings × Years) – Total Costs
- ROI % = (Net Profit / Initial Investment) × 100
Excel Formula Example:
=( (C5 * C6) – C4 ) / C4 * 100
(assuming C4=initial investment, C5=annual savings, C6=number of years)
Step 4: Present Outputs Clearly
Your outputs section (colored red) should clearly display:
- ROI Percentage
- Net Profit in currency
- Payback Period (how quickly they recoup their investment)
Use Excel’s built-in formatting to clearly show currency and percentages.
Step 5: Enhance with Visuals
Make your ROI calculator visually appealing and intuitive:
- Add bar charts or pie charts to visualize investment breakdowns or annual savings.
- Clearly label charts and ensure they’re easy to understand at a glance.
Common ROI Calculator Mistakes & How to Avoid Them
- Overcomplicating formulas: Keep calculations straightforward. Avoid overly complex or nested formulas.
- Ignoring flexibility: Make sure clients can easily adjust inputs. Locked-down fields frustrate users.
- Unclear labeling: Clearly label every input and output. Ambiguous fields create confusion and distrust.
Example Scenario
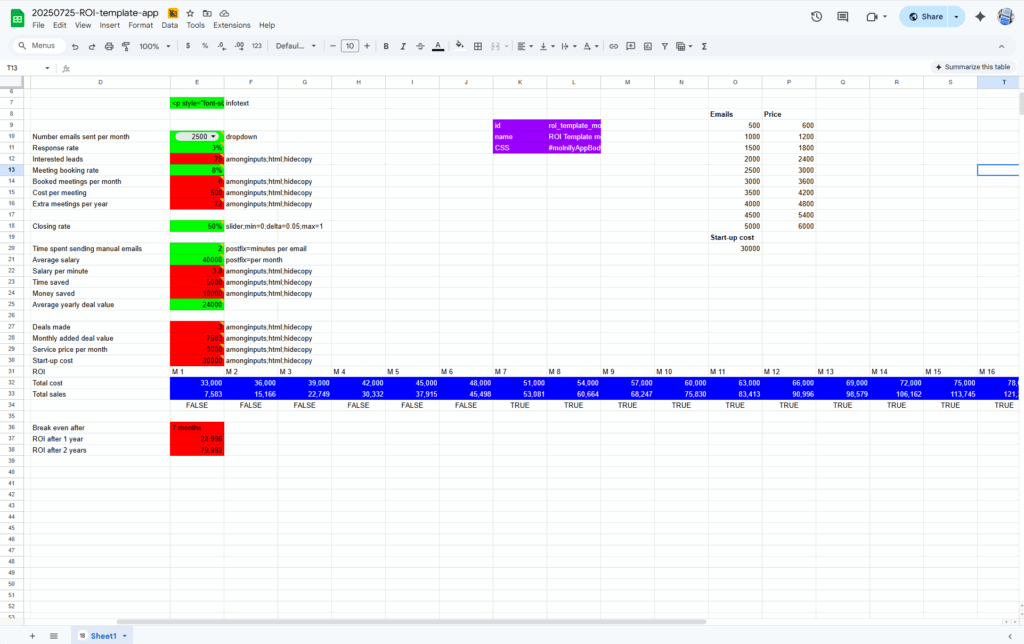
You run a sales team sending 2,500 outreach emails per month. You get a 3% hit rate, 8% of those book meetings, and your average deal is worth €2,085. You’re currently spending 5 minutes per email manually, and your team’s average monthly salary is €3,480.
Your ROI calculator app instantly shows:
Break-even: 7 months
ROI after 1 year: €2,175
ROI after 2 years: €6,955
Time saved: 12,500 minutes
Money saved: €4,130
And all of this is based on just a few simple inputs – editable directly in the app below.
This kind of clarity helps customers and stakeholders instantly understand the value.

From Excel ROI calculator to a shareable web app
Excel is an excellent tool for building ROI models and cost–benefit analyses. It’s fast, flexible and familiar.
Problems usually start when the model needs to be shared with customers, management or multiple stakeholders. Files get copied, versions drift apart and sensitive data becomes hard to control.
Turning an Excel ROI calculator into a web app solves these issues. The logic stays in Excel, but the calculator becomes a controlled, interactive tool that works on any device, supports multiple users and always shows the latest version.
This is where platforms like Molnify come in – keeping Excel as the logic layer while adding security, structure and shareability on top.

Ready to Get Started?
You can quickly download our ready-made Excel ROI calculator template here. For further insights, check our Use-Case page on ROI models.
Or better yet, turn your Excel ROI calculator into an easy-to-use web application with Molnify. No coding skills required—just a simple Excel file and a few clicks.
Below you can try the Excel model as an iframed application, and from there you can also access the model as a Google Sheets sheet for download (as an Excel file).
How to create a Molnify app
Watch this 3-minute video tutorial on how to create a model in Excel and how to upload it to Molnify. For more guides and examples, have a look at our written guides.
Molnify FAQ
Can I turn an Excel ROI calculator into a web app?
Yes.
An Excel ROI calculator can be uploaded to Molnify and turned into a secure, shareable web application. Inputs become form fields, formulas become live calculations, and outputs are displayed as results, tables or charts.
Is Molnify still Excel, or just a visual interface?
You create and update the business logic in Excel or Google Sheets using normal formulas. When the file is uploaded, Molnify reads it as a blueprint and builds a web application. The running app does not use Excel at runtime.
Does Molnify support PDF generation from Excel data?
Yes.
Molnify can generate PDFs using HTML templates combined with values and calculations from Excel. This is commonly used for ROI reports, sales quotes, offers and summaries generated directly from the app.
→ Written Guide: PDF generation
Can Excel-based apps in Molnify send emails?
Yes.
Molnify supports email Actions defined in Excel. Emails can be triggered by user actions or logic and can include dynamic content based on Excel formulas and database values.
→ Reference Guide: Email Action
Does Molnify include a database?
Yes.
Molnify includes a built-in SQL database. Apps can store records, history, user input and large datasets. Each record includes metadata such as timestamp, user and application ID and an app can fetch data from the database through SQL written directly in the Excel file via autoFill.
→ Written Guide: Data Manager
Can Excel formulas use data from the database?
Yes.
Using SQL Autofill, Molnify runs SQL queries defined in metadata cells and fills named ranges in Excel. Those values can be used directly in Excel formulas, enabling dynamic pricing, dashboards and personalized views.
→ Reference Guide: AutoFill
Can Molnify connect to APIs or external systems?
Yes.
Molnify actions can call external HTTP APIs. This allows integration with CRMs, ERPs, payment systems or internal services as part of the workflow.
→ Written Guide: HTTP-requests with Molnify
Can multiple users use the same Excel-based app at the same time?
Yes.
Molnify apps are multi-user. All users access the same application version with controlled permissions, secure login and shared data.
→ Written Guide: User Management
What happens when I update my Excel file?
You update the Excel or Google Sheets model and upload it again.
Molnify rebuilds the app instantly, and all users get the updated version without file distribution or version conflicts.
About Molnify
Molnify is a no-code platform that turns Excel and Google Sheets models into secure, multi-user web applications.
You build everything in Excel using normal formulas. Inputs, outputs, tables, charts and actions are defined with a simple color structure. When you upload the file, Molnify creates a web app in seconds – without rewriting logic, adding plugins or learning a new tool.
Molnify is used to build ROI calculators, pricing tools, quote systems, financial models and internal business tools that need to be shared, controlled and kept up to date.
Each app includes secure access, version control and a built-in SQL database for reliable data handling and automation – while Excel remains the logic layer.
If you already build business-critical models in Excel, Molnify lets those models behave like real software.